Examples
Sommaire
More examples
Here are some extra examples on artificial data. For each, we give:
- A description of the longitudinal data (the mean trajectories of each clusters, the noise function, the number of trajectories in
each groups, number of mesurement,...).
- The graphical representation of the data
- The graphical represantation of the calinski criterions
- An example of execution
- The R code
Three diverging lines
Artificial data parameters
- Cluster Number : 3
- time = 0 to 7
| Groupe A | Groupe B | Groupe C |
| Clusters size | 60 | 50 | 40 |
| Trajectory shape |  |
 |  |
| Noise function | 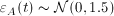 |
 |  |
| Missing in each cluster | 0% | 0% | 0% |
Graphical representation, Calinski criterion and execution
Click on the picture to start the demonstration.
R code
    dn1 <- generateArtificialLongData(
               nbEachClusters=c(60,50,40),
               functionNoise=function(t){rnorm(1,0,1.5)}
           )
    dn1 <- as.cld(dn1)
    plot(dn1)
    kml(dn1)
|
Three crossing lines
Artificial data parameters
- Cluster Number : 3
- time = 0 to 6
| Groupe A | Groupe B | Groupe C |
| Clusters size | 110 | 100 | 90 |
| Trajectory
shape |  |  |  |
| Noise function |  |  |  |
| Missing in each cluster | 0% | 0% | 0% |
Graphical representation, Calinski criterion and execution
Click on the picture to start the demonstration.
R code
    dn2 <- generateArtificialLongData(
               nbEachClusters=c(110,100,90),
               functionClusters=list(function(t){2},function(t){10},function(t){12-2*t}),
               functionNoise=function(t){rnorm(1,0,3)},
               time=0:6
	   )
    dn2 <- as.cld(dn2)
    plot(dn2)
    kml(dn2)
|
Four normal low
Artificial data parameters
- Cluster Number : 4
- time = 5 to 45
| Groupe A | Groupe B | Groupe C | Groupe D |
| Clusters size | 200 | 200 | 200 | 200 |
| Trajectory shape |
 |  |
 |  |
| Noise function |
| |
|  |
| Missing in each cluster | 0% | 0% | 0% | 0% |
Graphical representation, Calinski criterion and execution
Click on the picture to start the demonstration.
R code
    dn3 <- generateArtificialLongData(time=5:45,nbEachClusters=c(200,200,200,200),
	       functionCluster=list(
	           function(x){50*dnorm(x,20,2)},
                   function(x){50*dnorm(x,25,2)},
                   function(x){50*dnorm(x,30,2)},
                   function(x){25*dnorm(x,25,5)}
               ),
	       functionNoise=function(t){rnorm(1,0,1.5)}
           )
    dn3 <- as.cld(dn3)
    plot(dn3)
    kml(dn3)
|
Three lines and a polynome
Artificial data parameters
- Cluster Number : 4
- time = 0 to 10
| Groupe A | Groupe B | Groupe C | Groupe D |
| Clusters size | 100 | 100 | 100 | 100 |
| Trajectory shape |
| |
 |  |
| Noise function |
| |
|  |
| Missing in each cluster | 0% | 0% | 0% | 0% |
Graphical representation, Calinski criterion and execution
Click on the picture to start the demonstration.
R code
    dn4 <- generateArtificialLongData(
               nbEachClusters=c(100,100,100,100),
               functionClusters=list(
	           function(t){t},
	           function(t){0},
	           function(t){10-t},
	           function(t){-0.4*t^2+4*t}
	       ),
               functionNoise=function(t){rnorm(1,0,3)},
               time=0:10
	   )
    dn4 <- as.cld(dn4)
    plot(dn4)
    kml(dn4)
|
Three diverging lines with missing values
Artificial data parameters
- Cluster Number : 3
- time = 0 to 7
- Special: time 5, 10 and 15 considered as missing value.
| Groupe A | Groupe B | Groupe C |
| Clusters size | 60 | 50 | 40 |
| Trajectory shape |  |
|  |
| Noise function | |
| |
| Missing in each cluster | 30%+column(5,10,15) | 30%+column(5,10,15) | 30%+column(5,10,15) |
Graphical representation, Calinski criterion and execution
Click on the picture to start the demonstration.
R code
    dn5 <- generateArtificialLongData(
               functionClusters=list(
	           function(t){t/2},
	           function(t){0},
	           function(t){-t/2}
	       ),
               functionNoise=function(t){rnorm(1,0,3)},
               nbEachClusters=c(100,100,100),
	       time=0:20,
	       percentOfMissing=c(0.3,0.3,0.3)
           )
    dn5 <- as.cld(dn5)
    dn5@traj[,c(5,10,15)]<-NA
    plot(dn5)
    kml(dn5)
|
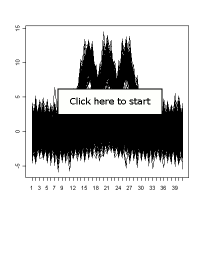
Two sinusoïdals
Artificial data parameters
- Cluster Number: 2
- time = 0 to 13
| Groupe A | Groupe B |
| Clusters size | 100 | 100 |
| Trajectory shape |  | 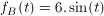 |
| Noise function | | |
| Missing in each cluster | 0% | 0% |
Graphical representation, Calinski criterion and execution
Click on the picture to start the demonstration.
R code
    dn6 <- generateArtificialLongData(
	       nbEachClusters=rep(100,2),
   	       functionClusters=list(
	           function(t){3*sin(t/2)},
                   function(t){6*sin(t)}
               ),
	       functionNoise=function(t){rnorm(1,0,3)},
               time=0:13
           )
    dn6 <- as.cld(dn6)
    plot(dn6)
    kml(dn6)
|
Three diverging lines, high variance
In this example, the high variance makes that the groups are very closed. Artificial data is build with 3 groups, but kml find only two.
Artificial data parameters
- Cluster Number : 3
- time = 0 to 8
| Groupe A | Groupe B | Groupe C |
| Clusters size | 60 | 50 | 40 |
| Trajectory
shape | | | |
| Noise function |  |  |  |
| Missing in each cluster | 30% | 30% | 30% |
Graphical representation, Calinski criterion and execution
Click on the picture to start the demonstration.
R code
    dn7 <- generateArtificialLongData(
               functionNoise=function(t){rnorm(1,0,5)},
               nbEachClusters=c(100,100,100),
               time=0:20
           )
    dn7 <- as.cld(dn7)
    plot(dn7)
    kml(dn7)
|